In this issue
- The recovery has continued, but we believe it is likely to flatten out without more fiscal policy support.
- A K-shape trend is in place, with manufacturing and remote workers seeing gains while service sectors decline.
- We see in the Fed’s policy shift reasons for bullishness after the U.S. election is resolved.
As a general rule, we are not big fans of overly clever, tongue-in-cheek titles. But, as we look ahead to the final quarter of what has been an unprecedented (that word again) year, we found this title an irresistible description of how we are thinking about the state of markets. It’s a comment on how, during the pandemic, the financial media has tried to label the shape of the recovery with a letter — V, W, U, and L have been popular.
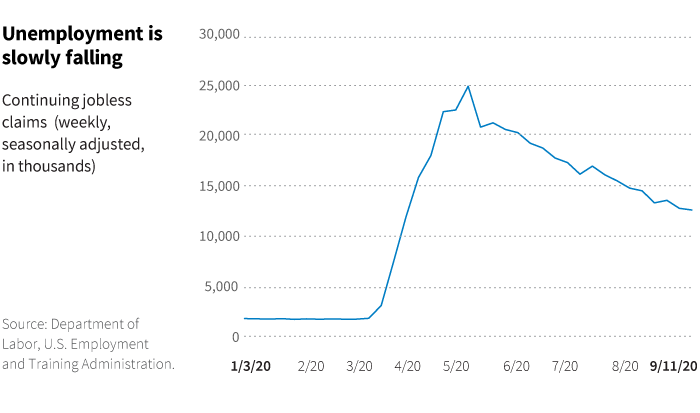
However, our concern since mid-summer was that the recovery could look like a square root symbol. Last quarter, we warned of the possibility of a drop in consumer spending that could be caused by a “fiscal cliff,” meaning the impending end of enhanced unemployment benefits on July 31. President Trump’s executive order to direct funds from the Department of Homeland Security’s disaster relief fund toward a supplemental $300/week benefit helped mitigate that drop. However, those funds likely ran dry by September, especially as FEMA needed to spend for wildfires in the West and hurricanes and flooding in the South.
Even with the income backstop from fiscal policy, many consumers are still hesitant to re-engage the service economy. It is unfortunate, as services are both the largest driver of U.S. GDP and the largest contributor to the 11.5 million still unemployed because of the pandemic. This describes a “K-shaped” recovery, when workers in manufacturing and white collar jobs who are able to work from home continue to recover, while those in face-to-face services jobs continue to struggle.
However, our primary concern since mid-summer was not a letter, but that the recovery could start to look like a square root symbol (√), i.e., a rapid decline followed by a sharp recovery but then a leveling out because of continued reluctance by consumers to engage with services until a vaccine is widely available. The high frequency indicators we follow with regard to mobility and employment have so far defied this thesis.
The recovery might plateau
However, a leveling out of the recovery remains a risk as students return to schools and seasonal flu season returns to the Northern Hemisphere. It is also troublesome that policy makers (save perhaps for Larry Kudlow and James Bullard) almost universally see the need for more fiscal stimulus, but messy political posturing continues to stand in the way of providing it.
Equity markets corrected a bit in the waning days of the third quarter, and one probable cause is what many regarded as a poor press conference by Federal Reserve Chair Jerome Powell following the FOMC meeting and statement on September 16. The lack of direction on additional asset purchases stemming from ongoing quantitative easing disappointed markets, and the forward guidance confused markets. The Fed committed to keep the policy rate anchored at zero until average inflation reaches the Fed’s 2% target and the economy achieves maximum employment. This guidance raised many questions, including exactly what Powell meant by maximum employment and what period the Fed will be using to target “average” inflation. In the speeches and press appearances by other FOMC members and by Powell himself over the days that followed, many felt these points still lacked clarity. As we all know, markets hate uncertainty.
The Fed’s new thinking on unemployment
However, we feel it is important not to lose sight of this fundamental shift in Fed thinking. The Fed is telling us that employment targets are now asymmetric. This means that policy can and will ease to reduce unemployment, but a declining rate of unemployment (even below the Fed’s assumed level of “full employment”) will not necessarily be a reason to tighten policy. In effect, this means that the United States is now likely to have the real policy rate (adjusted for inflation) in negative territory for years. (The real rate is the Fed funds target rate minus Core PCE, or personal consumption expenditure index.)
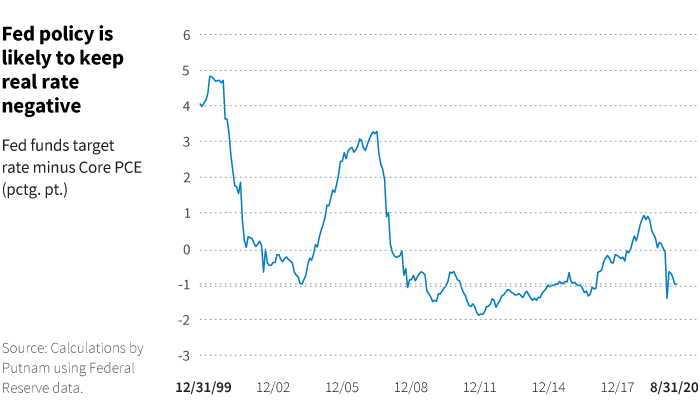
Recall that the fourth-quarter bear market in 2018 in large part resulted from the perception that the Fed was getting ahead of itself and making a policy mistake by tightening too soon and too fast. This new Fed guidance, first described in Powell’s speech to the Jackson Hole virtual conference, is in essence a guarantee that the Fed will not make that mistake again.
Analyzing the Fed’s stimulus
We conclude that on the surface this message should be bullish for risky assets as long as the United States does not experience outright deflation. The combination of negative real rates and rising money supply (year-over-year growth in M2, for example) is a stimulative mix, all else equal, given that fiscal policy is not outright restrictive. We also believe that longer-dated U.S. Treasury bonds will continue to be an effective diversifier to risky assets while inflation and inflation expectations stay low and the yield curve remains upward sloping.
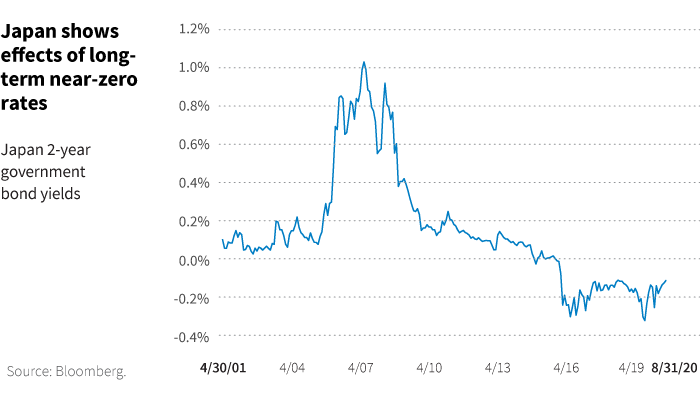
Our views are informed by the experience of Japan, which has been pursuing a zero interest rate policy (ZIRP) almost exclusively since the bursting of the tech bubble in 2000.
Japan offers stock and bond performance clues
The correlation between stocks and bonds has remained negative in Japan during that period. Since the first quarter of 2001 when short-dated Japanese government bonds first approached a zero yield, Japanese stocks have outperformed in “stimulative” periods. We define stimulative periods as those where both the short real yield was negative and M2 was growing year on year. In these periods, Japanese stocks have outperformed Japanese bonds by over 300 bps annually, with lower volatility on the excess return. In addition, a Japan balanced portfolio (60% stocks/40% bonds) experienced 60% higher risk-adjusted returns in the stimulative periods (Sharpe ratio of 0.42 versus 0.26).
After the election, risky assets could rally
Nearing the close of 2020, stubbornly high valuations and continued bouts of volatility driven by the pandemic and the U.S. presidential election keep us mostly on the sidelines with tactical asset allocation. The election has the possibility of an uncertain outcome and could drag on for weeks or months. However, the removal of concerns about monetary policy becoming restrictive will provide a tailwind, we believe, once we view the aforementioned risks as being properly priced.

